Dashboard
Calendar
Display calendar
When to use:
Used when checking the aggregation period of data displayed on the dashboard.
Users:
Manager/Operator
Screen Images:
Detail Specifications:
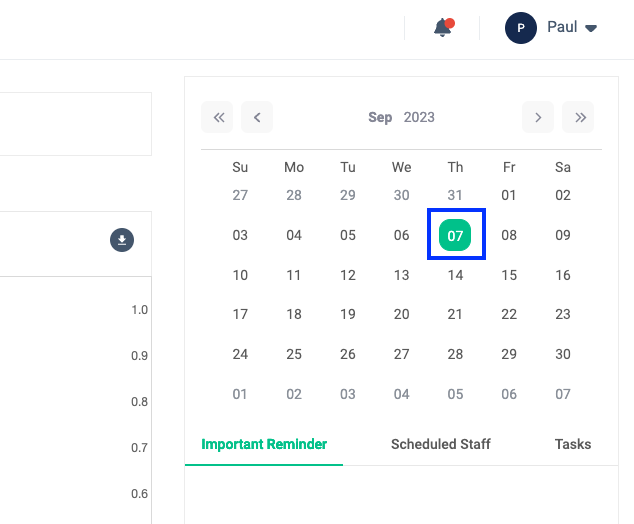
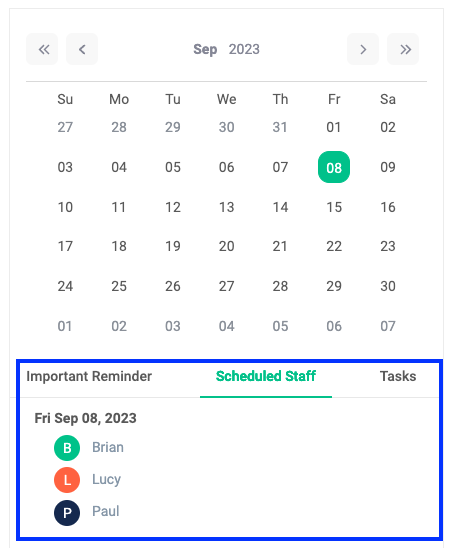
- When you open a dashboard, the date you opened it on is selected by default. This is useful when checking which period the data displayed on the dashboard is from.
- Even if you change the period, a green frame will be displayed around the date that corresponds to today.
- To change the display period, see#Select a day/time period on the calendar.
Calendar selection
When to use:
Used when changing the display period of data displayed on the dashboard.
Users:
Manager/Operator
Screen Images:
Detail Specifications:
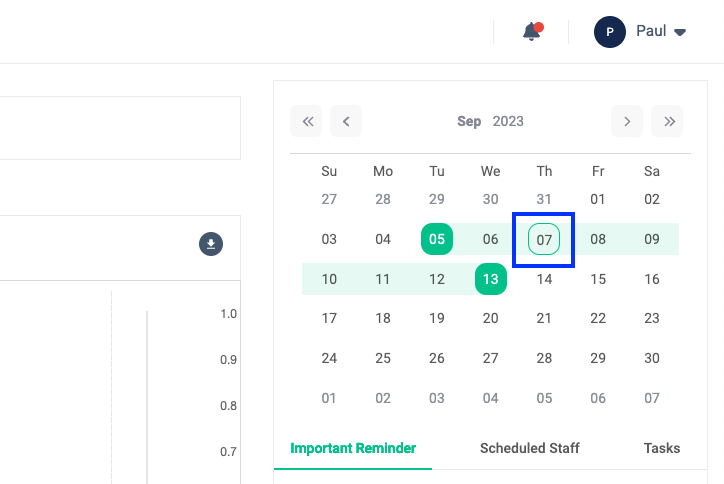
- You can change the data display period by clicking on the date on the calendar. It is also possible to select a period that spans multiple days.
- The behavior when clicked is as follows.
- If only one day is selected, click another day once to select multiple days.
- If you select multiple days and click the start date or end date, only the clicked date will be selected.
- When you click to change the period, the display data acquisition process will start. The date cannot be changed while data is being acquired.
- If you select a long display period, it may take some time to load the graph. We recommend that you select only the period you need and view the data.
Display delivery tasks
When to use:
Use this when you want to check whether there are any orders scheduled for delivery during the period selected on the calendar.
Users:
Manager
Screen Images:
Detail Specifications:
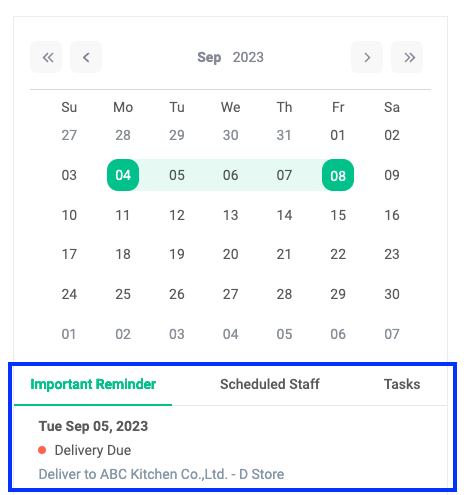
- If the period specified in the calendar includes the date on which you placed the delivery task when creating the cultivation plan, it will be displayed as an "Important Reminder".
Display work schedule
When to use:
Use this when you want to know the users who are scheduled to be active during the period selected in the calendar.
Users:
Manager
Screen Images:
Detail Specifications:
- Displays a list of users scheduled to work during the selected period. The list reflects the facility selected in "Location" at the top left of the screen and each user's vacation schedule.
Displaying task progress
When to use:
Use this when you want to check the progress of tasks scheduled during the period selected on the calendar.
Users:
Manager
Screen Images:
Detail Specifications:
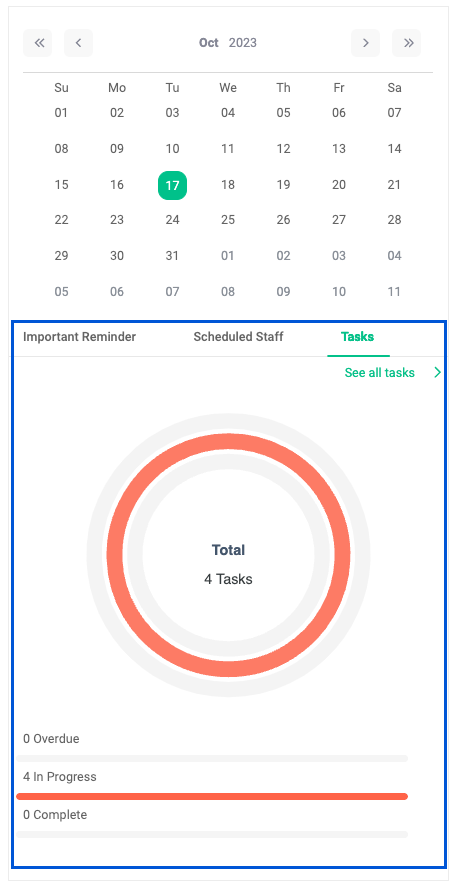
- Displays the progress of scheduled tasks during the selected period in pie chart format.
- Tasks scheduled in the facility selected in "Location" at the top left of the screen will be displayed.
- Chart includes both cultivation and maintenance operations.
- Clicking "See all tasks" will take you to the task list screen.
Sensor data graph
Selection of graph parameters
When to use:
Used to select the content to be displayed in the graph when checking the farm environmental status using the graph.
Users:
Manager/Operator
Screen Images:
Detail Specifications:
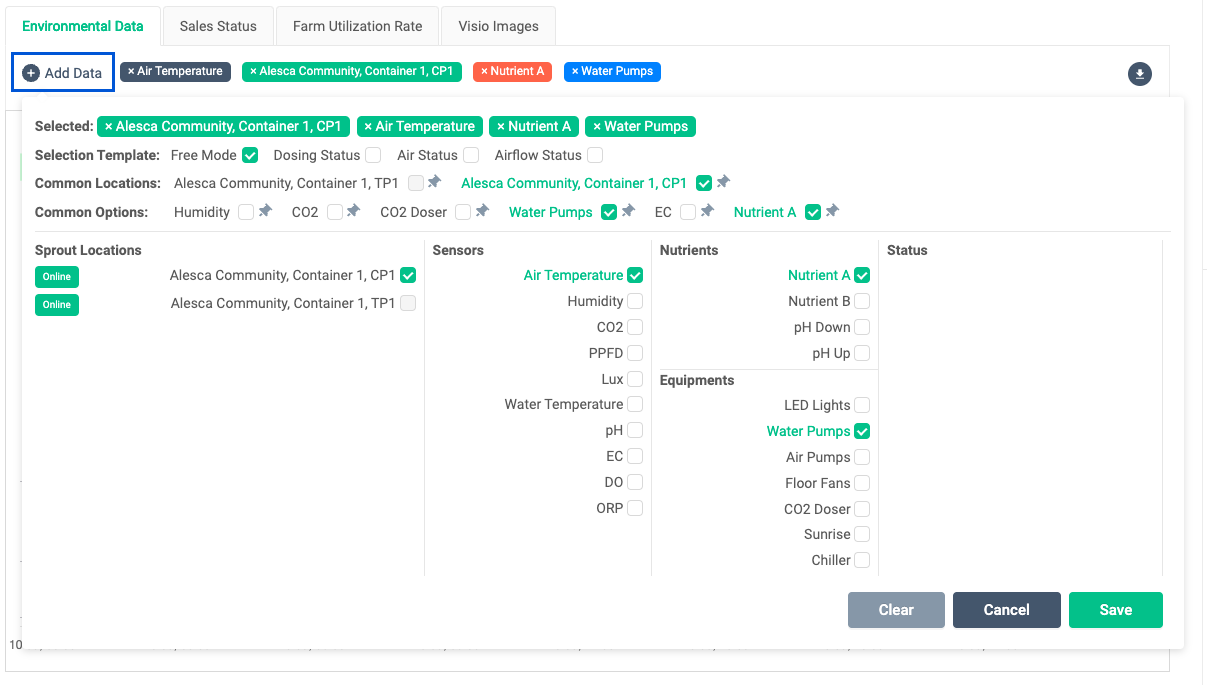
Click "Add Data" located at the top left of the graph area. A parameter screen will appear where you can select what to display in the graph. There are restrictions on the combinations of parameter selections. Check the table below.
| Sprout Locations | Sensors | Nutrients | Equipments |
|---|---|---|---|
| Select only one | up to 2 | no limit | no limit |
| Select 2 or more | up to one | Can not be selected | Can not be selected |
Each item will be explained individually below.
Selected
- The currently selected area and sensor data keys are displayed. You can cancel the selection by clicking it.
Selection Template
- Frequently checked items are saved as templates, and specific sensor data keys are automatically selected by clicking on them.
- Dosing Status
- Air Status
- Airflow Status
Common Locations
- Displaying the last 6 areas selected. You can freeze the display by clicking the pin next to the area name.
Common Options
- Displaying the last six selected sensor data keys. You can freeze the display by clicking the pin next to the key name.
Sprout Locations
- Displays a list of Sprouts installed on the farm you selected. Select the area you want to display in the graph.
- You can check the Online/Offline status.
caution
Online/Offline indicates the network connection status. Please note that this is different from the power status of Sprout itself.
- You can select up to 16 areas. However, in this case, only one
Sensorskey can be selected.
Sensors
- Displays the key of sensor data to be displayed as a graph. Select the sensor data key you want to display.
- Up to two keys can be selected. However, in this case, only one
Sprout Locationsarea can be selected.
Nutrients
- Displays the key to display the liquid nutrients input status as a graph. Select the keys you want to display.
- There is no upper limit to the number of key selections. However, the condition is that only one is selected in the
Sprout Locationsarea.
Equipments
- Displays the key to the operating status of the device displayed in a graph. Select the keys you want to display.
- There is no upper limit to the number of key selections. However, the condition is that only one is selected in the
Sprout Locationsarea.
Clear
- Resets the currently selected area or key and changes it to an unselected state.
Cancel
- Closes the parameter selection screen. Parameter changes are not applied
Save
- Get graph data according to the contents of the selected parameters. Click this button when you have completed your selection.
Sensor Data
When to use:
Used to check sensor data measured by Sprout installed on the farm.
Users:
Manager/Operator
Screen Images:
Detail Specifications:
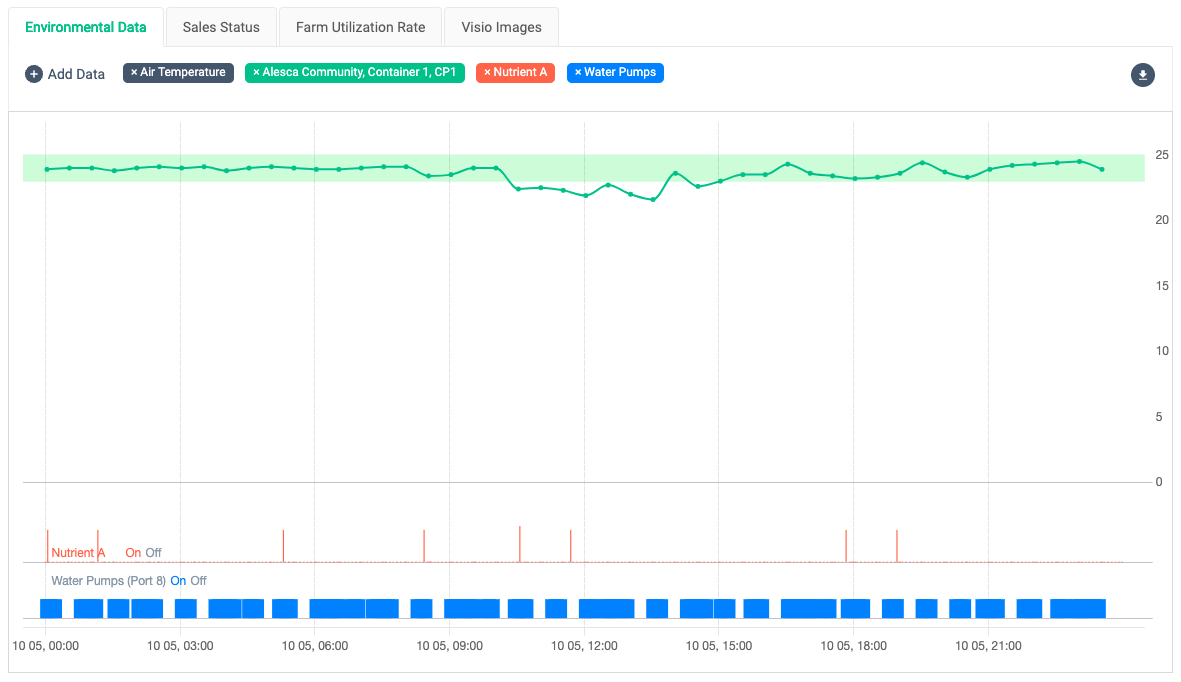
- Displays a graph based on the parameters selected in Selection of graph parameters
- Graphs are displayed for Sensors, Nutrients, Equipments.
We will explain the functions related to how to manipulate graphs of sensor data in order.
Displaying the average value graph

- If multiple areas are selected in Sprout Locations, the average value will be calculated from the values in each area and displayed on the graph.
- Click "Show Average". A graph of the average value will then be displayed.
- When you display the average value graph, the "Hide Average" button will be displayed, so click it if you want to stop displaying the average value.
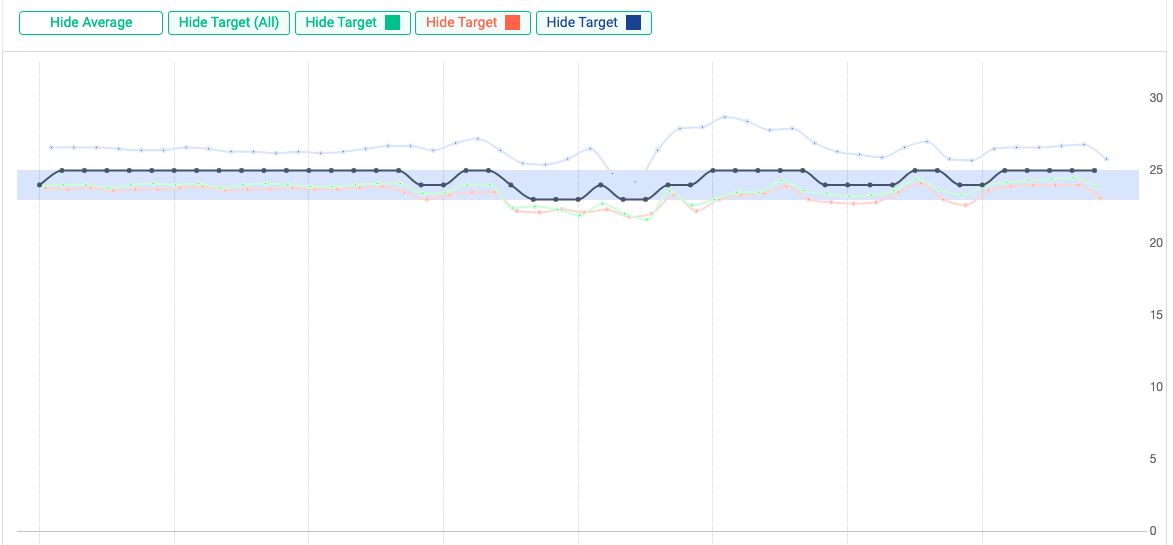
Show/hide targets
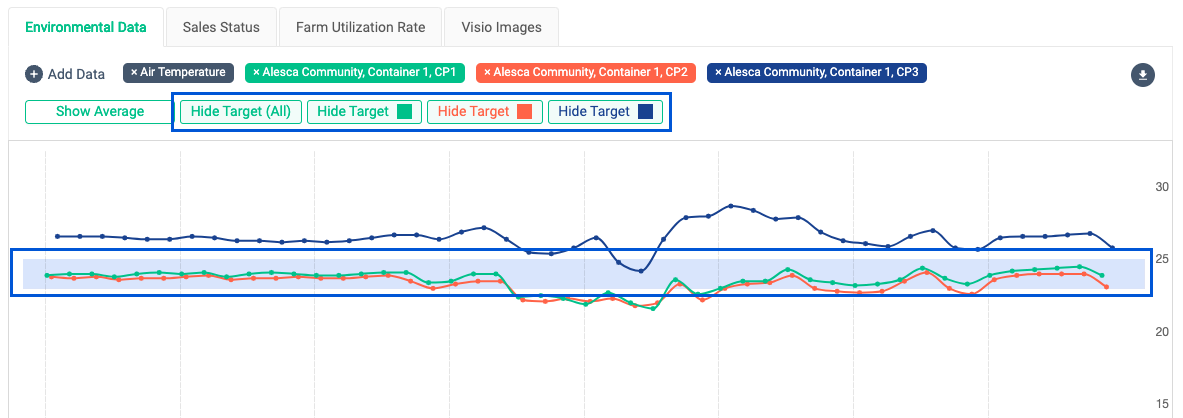

- Displays bands in the graph area based on the settings set in the environmental target. The area tag color and target color are linked.
- You can hide the target by clicking the "Hide Target" button.
- If you switch to hiding, the "Show Target" button will be displayed instead, so click it if you want to display it.
Display graph values
- You can check the graph values by hovering over the plot drawn on the graph.
zoom in
- The graph drawn on the graph can be enlarged by dragging and dropping the area.
- After zooming, a "Reset View" button will be displayed, so you can reset it by clicking the button.
CSV output
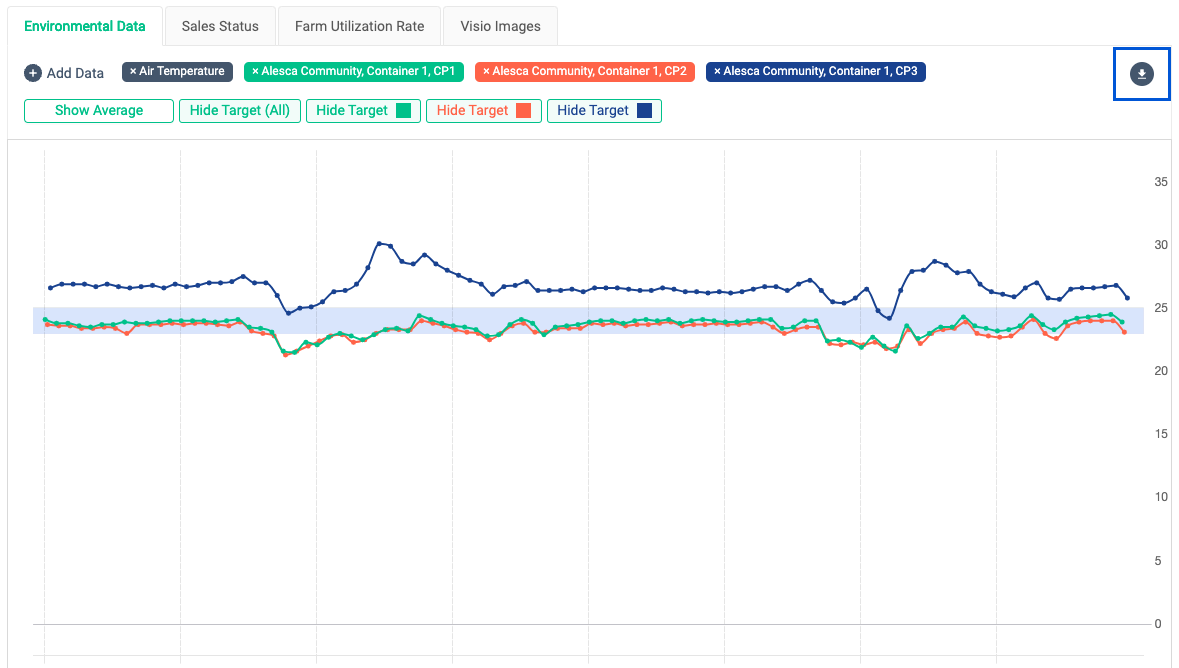
- Contents displayed on the graph can be output to CSV. Click the CSV download button at the top right of the graph area.
Sales status graph
When to use:
Use graphs to check past and future customer order status.
Users:
Manager
Screen Images:
Detail Specifications:
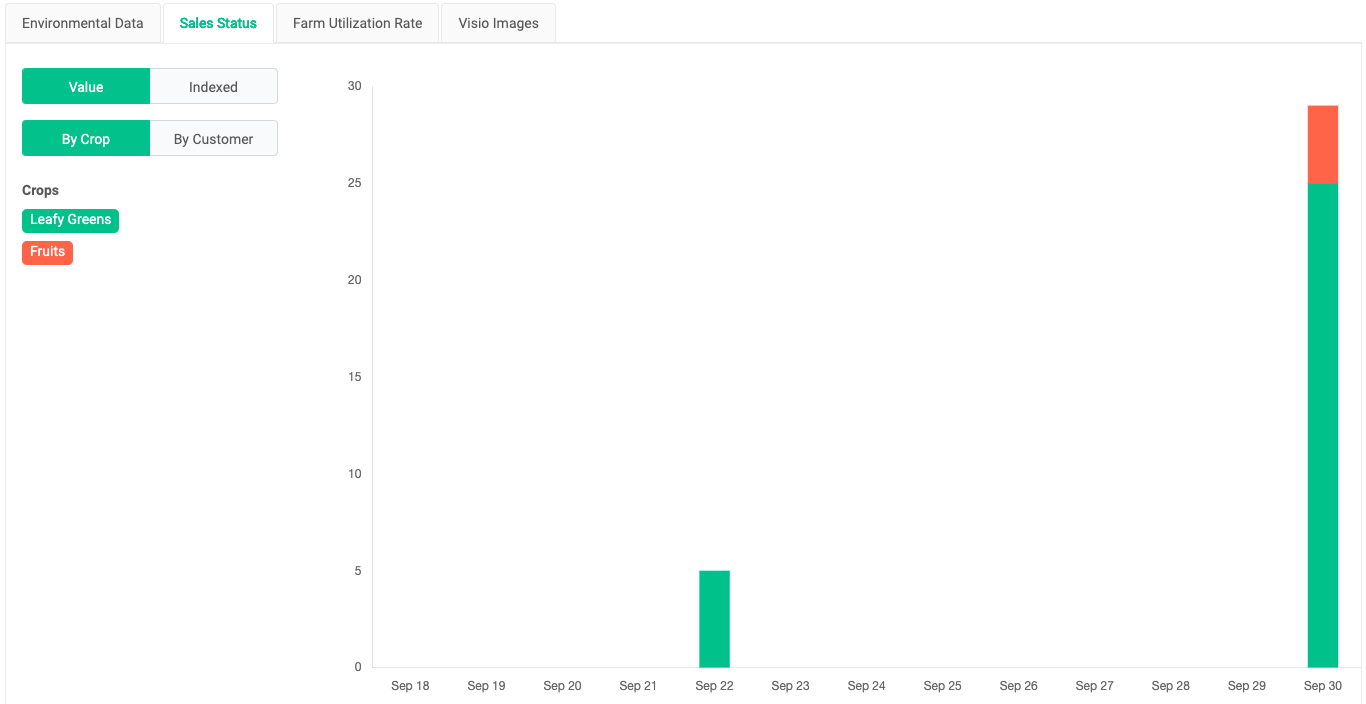
- Based on customer order information registered in Orion, past sales results and future sales volume plans are displayed based on the order quantity of vegetables.
- Displays data for +6 days before and after the period selected in the calendar.
Farm utilization graph
When to use:
Use the graph to check the usage rate of the farm.
Users:
Manager
Screen Images:
Detail Specifications:
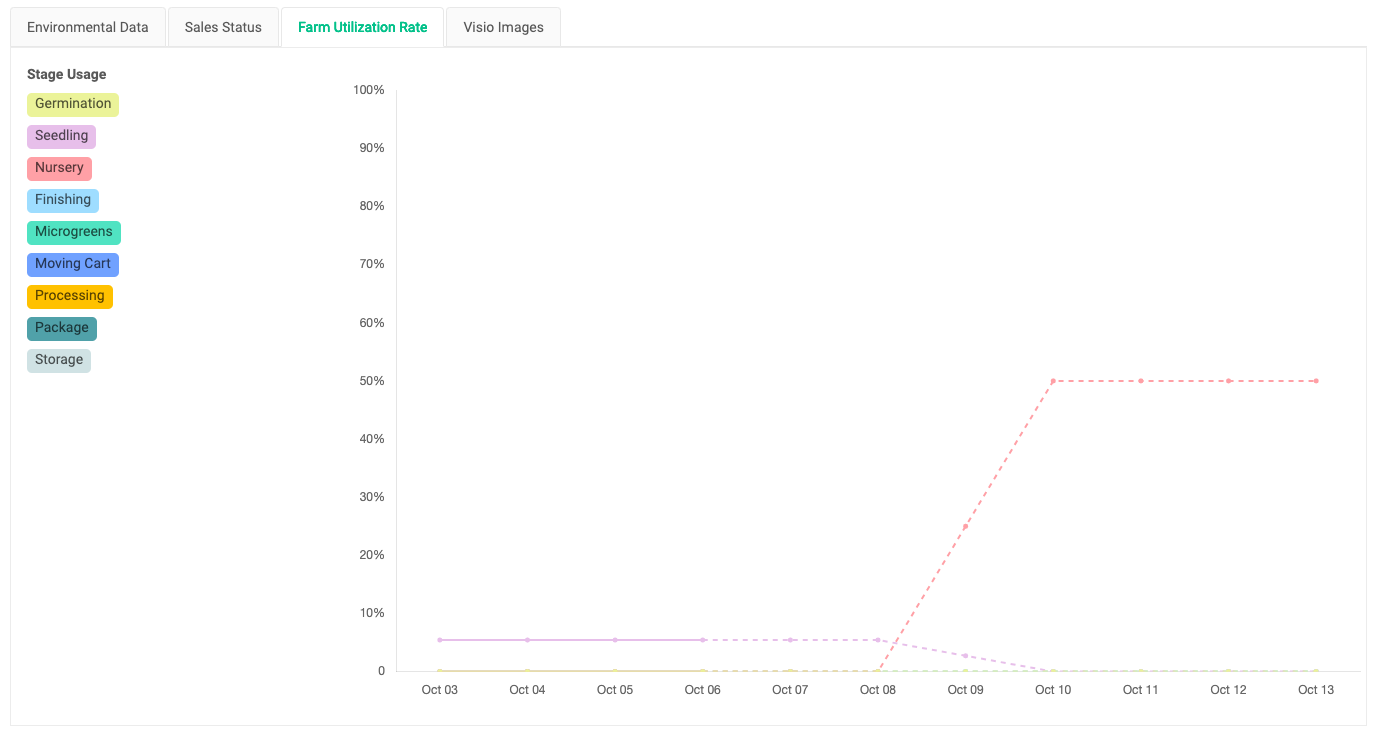
- Displays the utilization of the selected farm in a graph format.
- The graph is displayed based on the cultivation plan scheduled for the period selected in the calendar.
- The graph up to today is displayed in continuous line, and the future graph is displayed as a dotted line.
Warning
Sensor Data warning
When to use:
A warning will be displayed on the dashboard when sensor data violates the alert area specified by the environmental target. Use this to check the contents of the warning.
Users:
Manager/Operator
Screen Images:
Red Priority Warning

Orange Priority Warning

Yellow Priority Warning

Detail Specifications:
- Sensor data warnings are divided into three levels for each sensor key depending on their importance. Check out the table below.
| Priority | Color | Sensor Key |
|---|---|---|
| High | Red | AIR_TEMPERATURE |
| Middle | Orange | CO2, EC, PH |
| Low | Yellow | HUMIDITY, ORP, DO |
- Click on the warning title to expand the warning, check the details, and take action.
- Click "Go Check" to display the graph that is subject to the warning.
- You can let other users in your account know that you have read the warning.
- You can see that other users have confirmed the warning in the following text format.

- By clicking the check mark, you can update the warning to a resolved state. Warnings that have been resolved will not be displayed on the dashboard.
Don't forget to change the warning to resolved status once you have resolved the actual issue that is occurring on your farm! If there are 0 warnings, the following message will be displayed!

Customer Order warning
When to use:
When a new order is created from a customer, a warning will be displayed on the dashboard.
Users:
Manager
Screen Images:
Detail Specifications:
- A warning is created when a customer order is created or order information is updated.
- Please check Sensor Data warning for other basic usage instructions.